Performance
Private markets performance, J-curve and benchmarks
Pooled IRR, TVPI, DPI and the J-curve for the whole book or one vintage, compared with public benchmarks on a like-for-like basis.
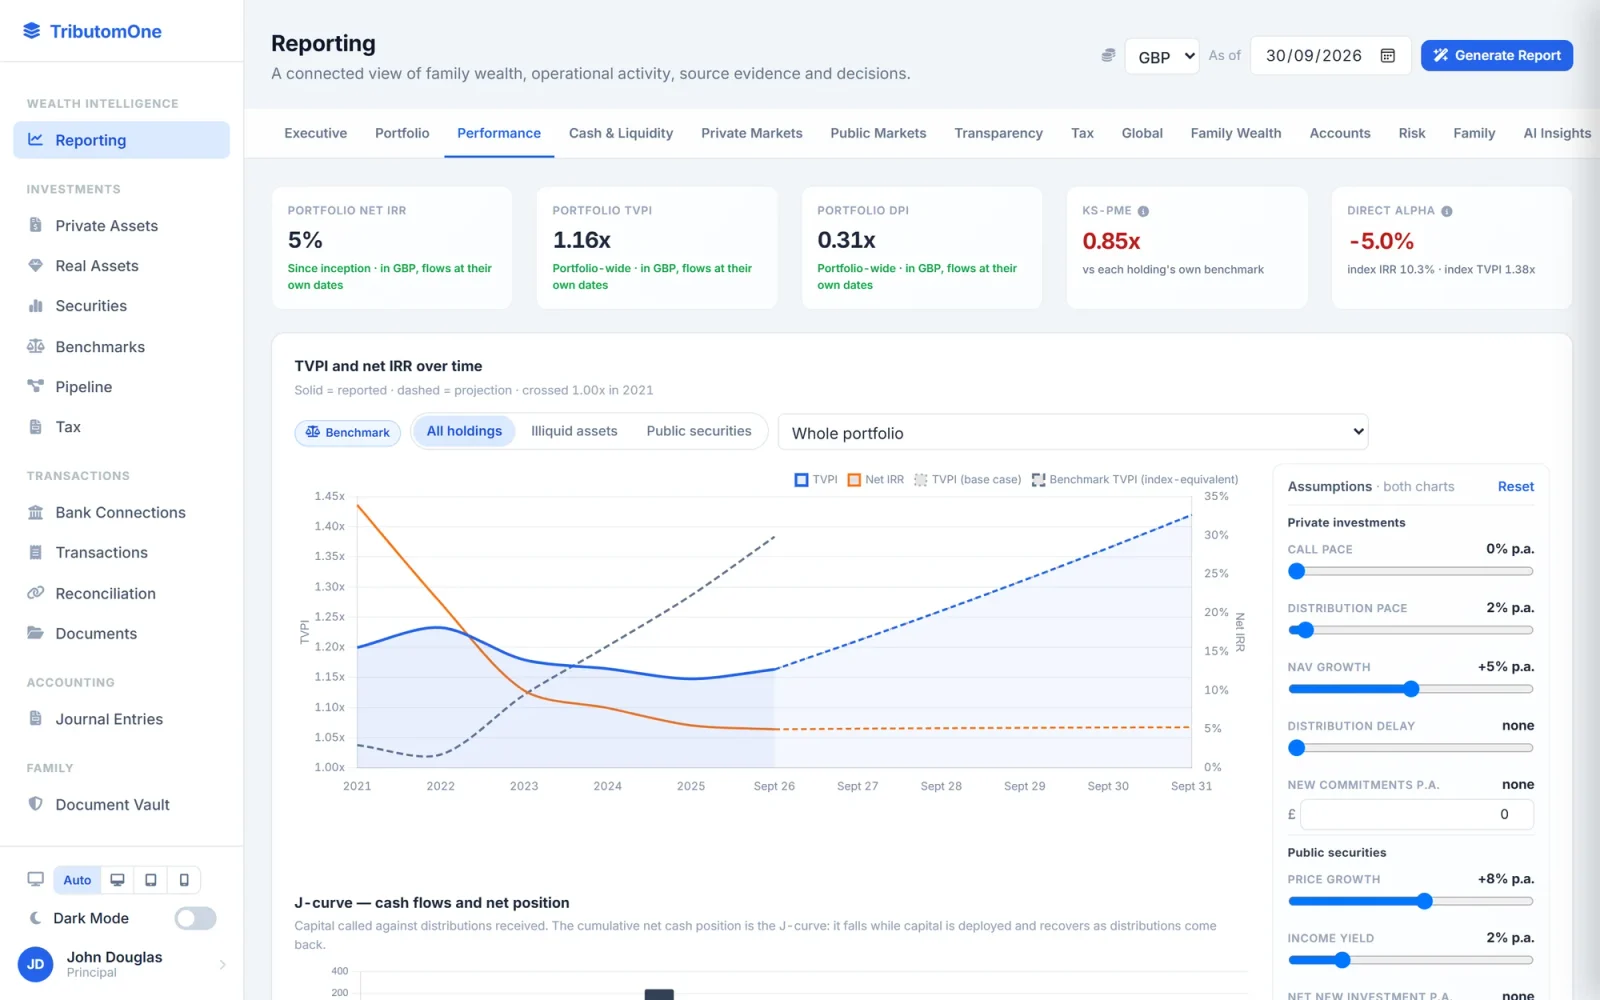
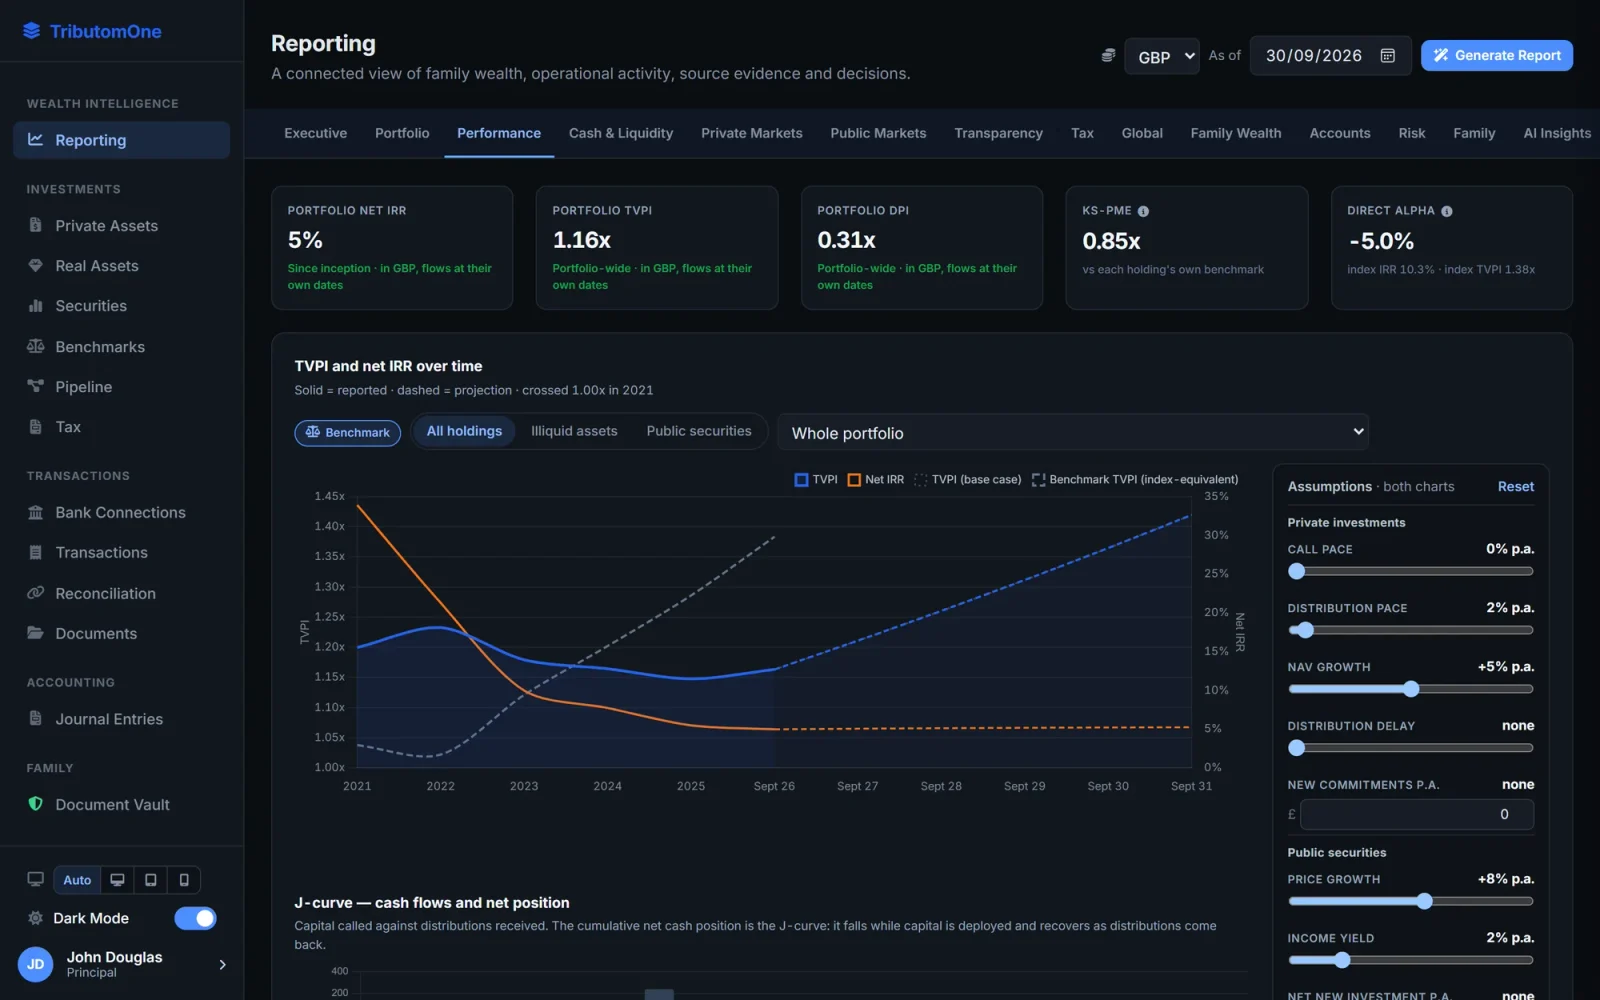
- J-curve by vintage, illiquid assets or the whole book
- Kaplan-Schoar PME and direct alpha against 30+ benchmark series
- Benchmarks assigned per holding, with premiums and blends
- The same maths in every view - computed in the database, once
The J-curve carries the projection and the benchmark comparison on one chart.
Strategic allocation - the actual book against the policy in force on the reporting date.
FAQ
Frequently asked questions
Works with
Reporting CentreNet worth, allocation, performance and cash for a family, a client or a whole book, drawn from the same register as the accounts - never from a spreadsheet. Consolidated wealth reporting and family office reporting software, built for everyone who manages private wealth.Private MarketsPlan the next commitments, model secondaries and co-investments on each fund's real flows, and keep the pipeline of what the family is considering next to the liquidity it would need.Public MarketsBrokerage statements become positions, income and realised gains - measured with exactly the same IRR and multiples as the fund book.
See Performance & Benchmarks on your own data.
A demo is a working session on the entities, funds and reporting you actually manage.
Book a demo